How to Use Stock Market Seasonality Chart Data with Cycle Timing
- Aug 15, 2025
- 10 min read
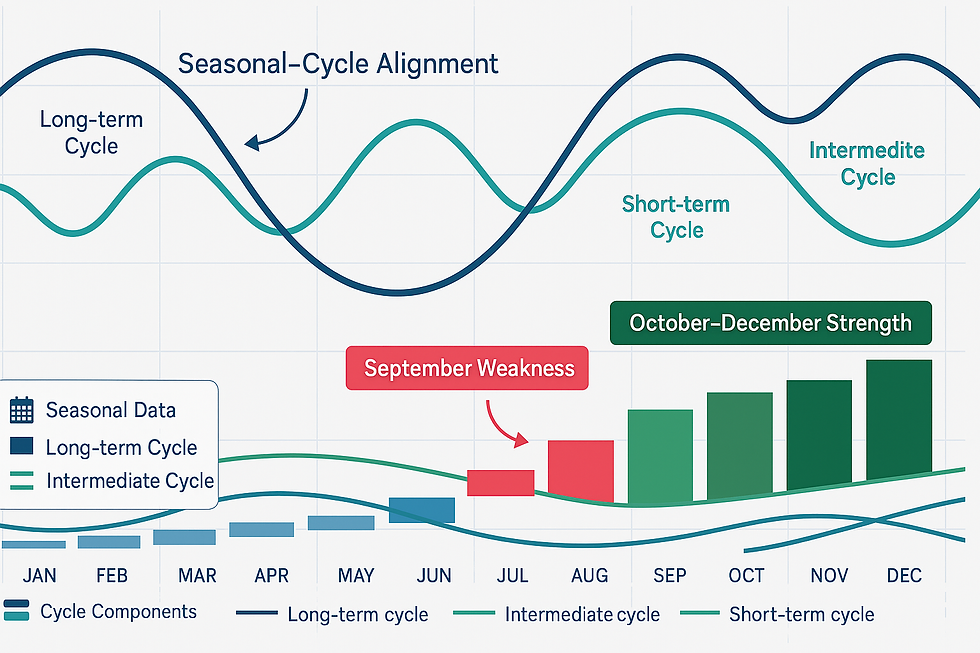
Most traders treat seasonal patterns and cycle analysis as separate tools, using one or the other but rarely combining them effectively. This disconnect causes them to miss the most powerful trading setups - when seasonal tendencies align with cycle projections to create high-probability opportunities. September provides a perfect example of this alignment in action.
Right now, cycle analysis is pointing toward weakness into September while seasonal data confirms that September historically ranks as one of the worst performing months across nearly all sectors. This convergence isn't coincidental - it represents the kind of multi-factor confirmation that creates the highest conviction trading opportunities.
At Market Turning Points, we've learned that successful market timing requires integrating seasonal patterns with cycle analysis rather than treating them as competing methodologies. This article will show you how to combine stock market seasonality chart data with cycle timing, why September presents unique risks that both approaches identify, and most importantly, how to position for the seasonal transition while maintaining longer-term cycle perspective.
Current Cycle Structure and Seasonal Context
Over the past three months, the SPX cycle structure has been strongly bullish. The long-term (white) and intermediate (magenta) cycles have stayed elevated, providing the rising tide that's carried prices steadily higher.
At the same time, the momentum (cyan) cycles has been far more actively oscillating - swinging from overbought to oversold - creating most of the expected intraday and multi-day turbulence we've navigated through the bigger uptrend.
From mid-May to now, we've also seen multiple short-term dips, each providing buying opportunities after finding quick support near 3 and 5-day averages.
This cycle behavior perfectly illustrates how seasonal strength can manifest through cycle analysis. The summer months' traditionally strong seasonal patterns have coincided with elevated longer-term cycles, creating the structural foundation for the sustained advance we've experienced.
Understanding this relationship helps explain why seasonal patterns work - they reflect the underlying institutional and economic rhythms that also drive cycle behavior. Summer strength occurs partly due to reduced institutional activity and stronger economic activity, factors that also show up in cycle analysis. This integration of multiple time-frames aligns with using swing trading indicators that matter for timing and clarity.
September Seasonal Weakness Confirmed by Cycle Projections
Looking forward, the SPY Daily Price Cycle Projections show the summed cycle line rolling into a mild peak as we close out August, with a modest weak patch projected into September.
This projection dovetails well with a 20+ year sector seasonality table I just compiled (numbers represent percentage gained/lost):
September has historically been one of the weakest months across nearly all S&P sectors, with both average returns and win rates dropping sharply. That seasonal headwind, paired with the short-term and momentum cycle peaks we're projecting now, raises the odds of a temporary stall - or even a sharper pullback - into mid-September.
The convergence of cycle and seasonal analysis creates much higher confidence in the September weakness scenario than either approach would provide individually. When multiple analytical frameworks point toward the same outcome, it typically indicates deeper structural forces at work rather than coincidental timing.
This alignment also helps explain the mechanism behind seasonal patterns. September weakness occurs partly due to institutional rebalancing, end-of-summer positioning changes, and back-to-work mentality shifts - factors that also influence the cycle rhythms we track through technical analysis.
Sector Rotation Patterns in September
The chart below makes September's risk even easier to see. Notice how the top-performing sectors in the preceding months have flipped to become the biggest losers in September.
This sector rotation pattern represents one of the most reliable aspects of September seasonality and provides specific guidance for portfolio positioning. Rather than just avoiding the market entirely, understanding which sectors typically underperform allows for more precise defensive strategies.
The sector rotation also creates opportunities for those positioned correctly. While growth sectors that led summer rallies typically struggle in September, defensive sectors often show relative strength during the seasonal weakness period. This rotation pattern can be captured through sector-specific positioning rather than broad market bets.
Combining sector seasonality with cycle analysis helps time these rotations more precisely. When cycle analysis confirms that defensive positioning is warranted and seasonal data shows which sectors typically benefit, it creates specific actionable strategies rather than vague market timing guidance.
Integrating Seasonal Data with Cycle Analysis
The key to using stock market seasonality chart data effectively lies in treating seasonal patterns as one input within a broader cycle framework rather than as standalone trading signals. Seasonal tendencies provide context for cycle projections while cycle timing provides specific entry and exit guidance for seasonal strategies.
This integration approach prevents the common mistake of rigidly following seasonal patterns without considering current market structure. While September is historically weak, the magnitude and timing of that weakness varies significantly based on cycle positioning going into the month.
When longer-term cycles remain bullish heading into seasonally weak periods, the weakness tends to be shallow and short-lived. When cycles are already declining, seasonal weakness can be amplified and extended. Understanding this relationship helps calibrate expectations and position sizing for seasonal trades.
The current environment shows longer-term cycles remaining elevated despite short-term weakness projections, suggesting September weakness should be viewed as a temporary consolidation within a larger uptrend rather than the start of a significant correction. This perspective aligns with understanding bullish continuation patterns that align with intermediate cycle timing.
Positioning Strategy for Seasonal Transitions
What It Means:
Where we've been: Riding a rising long-term and intermediate trend, with short-term dips bought steadily.
Where we're going: A likely shift into consolidation or modest downside in September, in line with both cycle projections and historical sector weakness.
How to trade: Maintain core long positions for now, still anchored to the long-term uptrend, but be selective with new entries until the short-term and momentum cycles reset from oversold next month. That reset should align with a deeper intermediate cycle low and should set up a strong re-entry window heading into the more favorable October–December seasonal period.
This positioning strategy demonstrates the practical application of combining seasonal and cycle analysis. Rather than making binary decisions based on either approach alone, it creates a nuanced strategy that accounts for both seasonal tendencies and cycle positioning.
The approach maintains longer-term exposure based on cycle structure while adjusting tactical positioning based on seasonal expectations. This prevents the mistake of completely exiting markets during seasonally weak periods when longer-term cycles remain supportive.
The October-December reference provides the forward-looking component that makes seasonal analysis actionable. By understanding both the expected weakness and its likely duration, traders can position for the subsequent seasonal strength rather than just defending against near-term weakness.
Risk Management During Seasonal Weak Periods
Effective risk management during seasonal weak periods requires adapting position sizing and stop placement to account for both seasonal volatility patterns and cycle support levels. September's historical weakness suggests larger-than-normal position swings, requiring wider stops or smaller position sizes to avoid getting shaken out by normal seasonal volatility.
The cycle framework provides specific guidance for stop placement during seasonal transitions. Key support levels like moving average crossovers and cycle-based support zones offer objective reference points that don't change based on seasonal expectations, eliminating the guesswork about how much seasonal weakness to tolerate.
Sector-specific risk management becomes particularly important during September as different sectors experience varying degrees of seasonal pressure. Understanding which sectors typically underperform most severely allows for targeted position adjustments rather than broad defensive measures.
The seasonal context also affects the timing of risk management decisions. Early September typically shows the most pronounced seasonal effects, while late September often begins showing signs of October seasonal strength building. This timing pattern helps calibrate when to implement defensive measures and when to prepare for re-entry.
Using Seasonality to Time Cycle-Based Entries
One of the most powerful applications of combining seasonal and cycle analysis involves using seasonal weakness periods to establish positions for subsequent cycle advances. September weakness often creates attractive entry points for strategies targeting October-December seasonal strength, especially when cycle analysis confirms the timing.
This forward-looking approach transforms seasonal weakness from a threat into an opportunity by providing specific timing guidance for strategic positioning. Rather than simply avoiding September, traders can use the expected weakness to improve entry points for longer-term cycle-based strategies.
The key is distinguishing between seasonal weakness that offers opportunities and seasonal weakness that signals deeper problems. When longer-term cycles remain supportive, seasonal weakness typically creates buying opportunities. When cycles are also declining, seasonal weakness may indicate more significant corrections ahead.
Current market conditions suggest the former scenario - seasonal weakness within a supportive longer-term cycle environment that should create tactical opportunities rather than strategic concerns. For traders using leveraged instruments to capitalize on these opportunities, understanding TQQQ trading strategy and how to win using stock market cycles becomes particularly relevant during seasonal transition periods.
People Also Ask About Stock Market Seasonality Chart
How reliable are stock market seasonality chart patterns for trading?
Stock market seasonality chart patterns are most reliable when combined with cycle analysis and current market structure rather than used as standalone trading signals. Historical seasonal data provides valuable context about typical market behavior, but the magnitude and timing of seasonal effects vary significantly based on economic conditions, cycle positioning, and market sentiment. September weakness, for example, is historically consistent but ranges from mild consolidation to significant corrections.
The reliability increases substantially when seasonal patterns align with other analytical frameworks like cycle timing, technical support levels, and fundamental conditions. This convergence approach filters out false seasonal signals while identifying high-probability setups where multiple factors support the same directional bias. Traders who use seasonality as confirmation rather than prediction typically achieve better results than those who follow seasonal patterns mechanically.
What makes September historically the worst performing month?
September's poor historical performance stems from multiple institutional and psychological factors that create consistent selling pressure. End-of-summer rebalancing, back-to-work mentality shifts, and fund managers' tendency to reduce risk before quarter-end all contribute to reduced buying and increased selling activity. Additionally, September often coincides with Federal Reserve policy decisions and economic data releases that can create uncertainty.
The seasonal weakness is amplified by psychological factors as traders and institutions anticipate September weakness, creating self-fulfilling prophecy effects. When combined with typically lower summer trading volumes leading into higher fall activity, these factors create conditions where even modest selling pressure can have outsized price impact. Understanding these underlying causes helps traders position appropriately rather than simply following historical averages.
How do you combine seasonal data with technical analysis?
Combining seasonal data with technical analysis requires treating seasonal patterns as context for technical signals rather than replacement for them. Use seasonal expectations to calibrate position sizing, adjust stop levels, and time entries around technical support and resistance levels. For example, during seasonally weak periods like September, place stops wider to account for increased volatility while using seasonal weakness to establish positions near technical support levels.
The most effective approach involves using seasonal data to understand the broader environment while relying on technical analysis for specific entry and exit timing. When seasonal expectations align with technical signals - such as September weakness coinciding with cycle peaks or resistance levels - it creates higher-conviction trading opportunities. This integration prevents both the premature entries that come from following seasonal patterns too early and the missed opportunities that result from ignoring seasonal context entirely.
Which sectors perform best and worst during September?
September historically shows weakness across most sectors, but the magnitude varies significantly. Growth sectors like technology and consumer discretionary typically experience the largest declines during September, often giving back gains accumulated during summer months. Energy and financial sectors also tend to underperform, particularly when September coincides with economic uncertainty or Federal Reserve policy shifts.
Defensive sectors like utilities, consumer staples, and healthcare tend to show relative strength during September weakness, though they may still decline in absolute terms during broader market selloffs. Real estate and telecommunications also sometimes provide defensive characteristics during seasonal weakness periods. Understanding these sector rotation patterns allows for more precise positioning than broad market strategies during seasonal transitions.
How do you time re-entry after September seasonal weakness?
Timing re-entry after September seasonal weakness requires monitoring both cycle analysis and early signs of October seasonal strength building. Historical patterns suggest late September often begins showing stabilization signs, while early October typically marks the beginning of the strongest seasonal period of the year. However, exact timing depends on cycle confirmation and technical support levels holding during the weakness.
The most reliable re-entry signals combine cycle analysis showing short-term cycles turning up from oversold levels with seasonal expectations for October strength. This typically occurs when September weakness finds support at key technical levels like moving averages or previous support zones, confirming that the seasonal weakness is completing rather than accelerating. Position sizing should start conservatively and increase as both seasonal and cycle factors confirm the transition to strength.

Resolution to the Problem
The fundamental problem with using stock market seasonality chart data is treating seasonal patterns as mechanical trading signals rather than context for cycle-based analysis. Traders either ignore seasonality entirely, missing important timing cues, or follow seasonal patterns rigidly without considering current market structure and cycle positioning.
The solution lies in integrating seasonal data with cycle analysis to create a comprehensive market timing framework. Seasonal patterns provide the broader context while cycle analysis offers specific timing for entries, exits, and position adjustments. This combination creates higher-conviction trading opportunities while avoiding the false signals that come from using either approach in isolation.
Stop treating seasonality and cycles as competing methodologies and start using them as complementary tools that provide different perspectives on the same underlying market rhythms. Use seasonal data to understand the broader environment and cycle analysis for precise timing within that seasonal context.
Join Market Turning Points
Ready to stop using seasonal patterns in isolation and start integrating stock market seasonality chart data with cycle timing for higher-conviction trading decisions? Join the Market Turning Points community where we teach you exactly how to combine multiple analytical frameworks for superior market timing results.
You'll learn to identify when seasonal patterns align with cycle projections, how to use seasonal data for position sizing and risk management, and most importantly, how to time entries and exits using cycle analysis within seasonal contexts. No more guessing whether to follow seasonal patterns or missing opportunities by ignoring them entirely.
Join the Market Turning Points community today and discover why combining seasonality with cycle analysis provides better market timing than using either approach alone.
Conclusion
Stock market seasonality chart data becomes exponentially more powerful when combined with cycle timing rather than used in isolation. September's historical weakness gains much higher significance when cycle analysis confirms short-term peaks and momentum rollover, creating the kind of multi-factor confirmation that produces the highest-probability trading setups.
The current environment demonstrates this integration perfectly - seasonal data warning of September weakness while cycle projections show similar timing for temporary consolidation. This convergence provides much higher confidence than either signal alone while offering specific guidance for positioning through the seasonal transition.
The next time you analyze seasonal patterns, integrate them with your cycle analysis rather than treating them as separate tools. Use seasonal data to understand the broader context and cycle timing for specific entries and exits within that seasonal framework. This approach transforms seasonality from a general tendency into actionable trading intelligence.
Author, Steve Swanson